Biology
- Diffusion And Osmosis
Movement in a and out of cells (some key terms): Diffusion: the movement of a substance from a high concentration to a lower one as a result of their random movement. Give an example of diffusion Osmosis: The diffusion of water molecules from a...
- # 73 Drawing Conclusions And Interpreting Data
Once you have collected, tabulated and displayed your results, you can use them to draw a conclusion. When you are thinking about a conclusion, look right back to the start of your experiment where you were told (or you decided) what you were to investigate....
- #69 How To Get High Marks In Paper 3 - Variables
Many of the experiments that you will do during your AS course, and usually Question 1 in the examination paper, will investigate the effect of one factor on another. These factors are called variables. Types of variables The factor that you change...
- # 39 The Need For Transport Systems In A Multicellular Organism
The transport system enables the rapid delivery of nutrients and O2 to as well as the removal of metabolic waste products (including CO2) from all cells of the body for survival. All cells need to take in substances from their...
- #23.1 Cell Membranes And Transport - Syllabus 2015
? Fluid mosaic model of membrane structure ? Movement of substances into and out of cells Learning Outcomes Candidates should be able to: (a) describe and explain the fluid mosaic model of membrane structure, including an outline of the roles of phospholipids,...
Biology
# 26 Surface area to volume ratios, Investigating diffusion
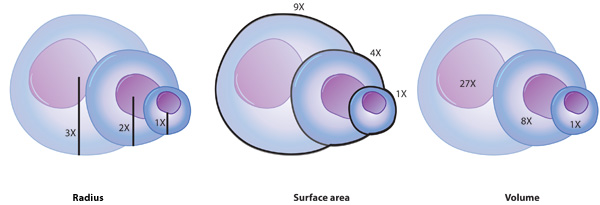 |
| As the radius of a cell ? from 1x to 3x (left), the surface area ? from 1x to 9x, and the volume ? from 1x to 27x. Source: Nature Education |
As a cell increases in size, there is less surface area in proportion to its volume.
Relatively there is less surface area of cell mebrane over which inffusion can coccur.
As the cell grows and increases in size, their surface area - and thus their ability to take in nutrients and transport electrons - does not increase to the same degree as their volume.
The volume ? faster than the surface area --> surface area/volume (SA/V) ratio ?.
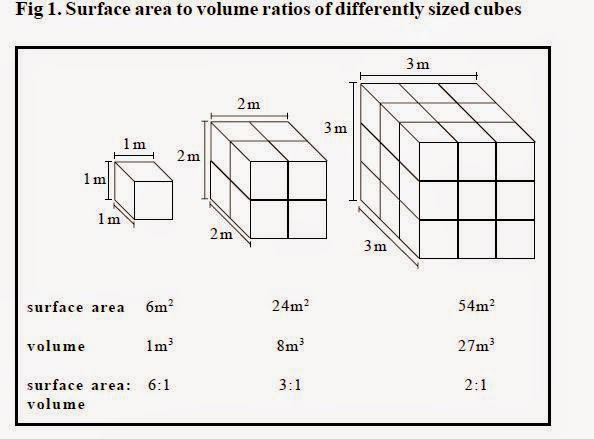
So, with increasing size of a cell, less of the cytoplasm has access to the cell surface for exchange of gases, supply of nutrients, and loss of waste products --> the smaller the cell is, the more quickly and easily can materials be exchanged between its cytoplasm and environment. That's why cells cannot continue growing larger, indefinitely. When a maximum size is reached, cell growth stops.
Experiment:
The volume ? faster than the surface area --> surface area/volume (SA/V) ratio ?.

So, with increasing size of a cell, less of the cytoplasm has access to the cell surface for exchange of gases, supply of nutrients, and loss of waste products --> the smaller the cell is, the more quickly and easily can materials be exchanged between its cytoplasm and environment. That's why cells cannot continue growing larger, indefinitely. When a maximum size is reached, cell growth stops.
Experiment:
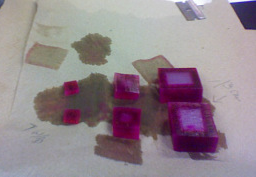
- Use some cubes cut from agar gel that had an indicator added to it.
- Place the agar blocks into Sodium Hydroxide (NaOH) solution, the bright pink colour of the agar blocks showed how far the NaOH had diffused.

Simple experiments on diffusion and osmosis
using living and non-living systems
a. Cubes of agar jelly placed into solutions of methylene blue or potassium permanganate will absorb the pigment by diffusion. The cubes are left in the pigmented solution for different measured periods of time and are then sliced open. The distance between the edge of each cube and the edge of the coloured agar may be used as a measure of the distance the pigment molecules have moved by diffusion.
b. A crystal of potassium permanganate can be dropped into a beaker of water and the
appearance of the water noted over time.
c. To demonstrate osmosis, Visking tubing (dialysis tubing) can be tied at one end and filled with 20% sucrose solution. The other end is attached to a capillary tube. The level of the sucrose can be noted before and after the tubing has been placed in a beaker of water for about 30 minutes.
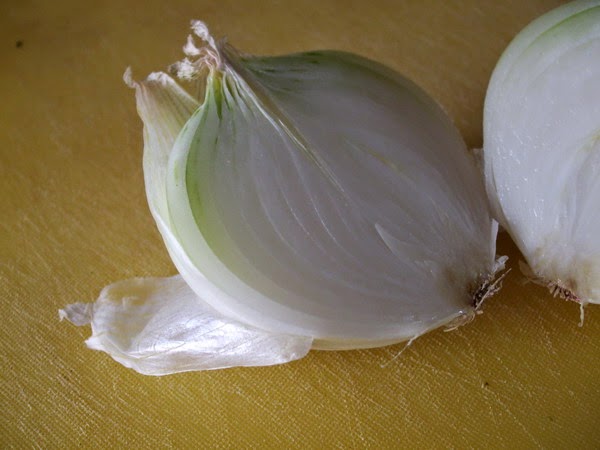
d Onion epidermis can be peeled away, cut into squares and mounted on slides in different concentrations of sucrose solution. Observation under a microscope will show the effects of osmosis.
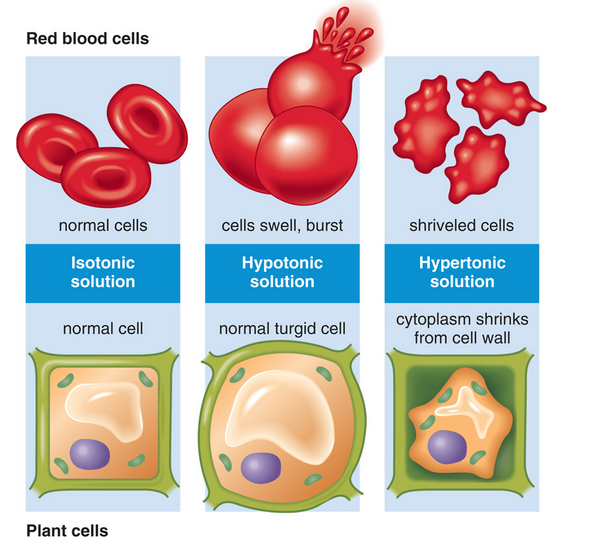
e. Red blood cells in blood obtained from a butcher may be mounted on slides in hypotonic, isotonic and hypertonic saline, and observed under a microscope to show the effects of osmosis.
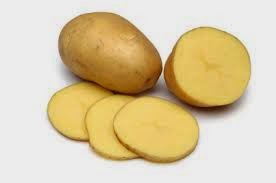
f .To cut potato cubes of different sizes, which have different surface area to volume ratios. After measuring and recording the masses of the cubes, they are immersed in water. After one hour, the cubes are blotted dry and their masses measured and recorded again. The percentage increase in mass for cubes of different surface area to mass ratio can be compared, to explore the concept of how surface area to volume ratio influences water uptake.
Investigating the effect on plant cells of immersion
in solutions of different water potentials
 |
| Source: McGraw - Hill companies. |
There are several different ways in which this investigation could be done. They include:
? cut cylinders or discs or strips of a solid and uniform plant tissue, such as a potato tuber, then measure either their lengths or masses before immersing them in the solutions. Leave them long enough for them to come to equilibrium, and then measure the length or mass of each piece again, and calculate the percentage change in the measurement. Percentage change can then be plotted against the concentration of the solution.

? cut small pieces of single-cell-thick plant tissue, for example onion epidermis (skin). Mount them in a drop of sugar solution on microscope slides, and count the percentage of cells plasmolysed, or score each cell you see according to how plasmolysed it is.
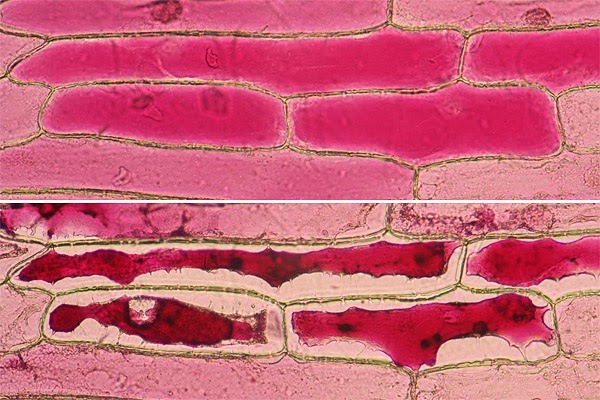 |
| The top image shows the cells before plasmolysis. The cells are filled with a red pigment and appear pink. The bottom image shows the same cells after the addition of saturated salt water. Intact cells will lose much of the water due to osmosis. The concentration of the pigment rises resulting in a darker color. The shape of the cell wall remains unaffected. |
For the plasmolysis investigation, you could use this method:

? Peeloff one of the thick layers from an onion bulb. Cut 6 approximately 1 cm2 pieces from it, put each piece into a different liquid. One should be distilled water, then a range of sucrose solutions from about 0.1 mol dm-3 up to 1.0 mol dm-3.
? Take six clean microscope slides and label each with the concentration of solution you are going to place on it. Put a drop of the relevant solution on each one.
? Peel off the inner epidermis from one of the 1 cm2 pieces of onion, and place it carefully onto the drop on a slide of the same concentration solution in which it has been immersed. Take care not to let it fold over. Press it gently into the liquid using a section lifter or other blunt tool. Carefully place a coverslip over it, taking care not to trap air bubbles.
? Repeat with each of the other drops of liquid. Leave all of the slides for at least 5 minutes to give any water movements by osmosis time to take place and equilibrium to be reached.
? Observe each slide under the microscope. Count the total number of cells in the field of view and record this. Then count the number that are plasmolysed and record this. Then move to another area of the slide and repeat until you have counted at least 50 cells. Repeat for each slide.
? Calculate the percentage of cells that have plasmolysed in each solution. Add this to your results chart.
? Plot percentage of cells that have plasmolysed (y-axis) against the concentration of the solution (x-axis). Join the points with either straight lines drawn between points, or a best-fit curve.
? The point at which the line crosses the 50% plasmolysis level tells you the concentration of the solution at which, on average, cells were just beginning to plasmolyse. At this value, the concentration of the solution inside the onion cells was, on average, the same as the concentration of
the sucrose solution.
| Syllabus 2015 (d) [PA] investigate the effects on plant cells and the effect on animal cells of immersion in solutions of different concentrations of solutions (with different water potentials); |
Syllabus 2016 4.2 Movement of substances into and out of cells b) investigate simple diffusion using plant tissue and non-living materials, such as glucose solutions, Visking tubing and agar c) calculate surface areas and volumes of simple shapes (e.g. cubes) to illustrate the principle that surface area to volume ratios decrease with increasing size d) investigate the effect of changing surface area to volume ratio on diffusion using agar blocks of different sizes e) investigate the effects of immersing plant tissues in solutions of different water potential, using the results to estimate the water potential of the tissues |
- Diffusion And Osmosis
Movement in a and out of cells (some key terms): Diffusion: the movement of a substance from a high concentration to a lower one as a result of their random movement. Give an example of diffusion Osmosis: The diffusion of water molecules from a...
- # 73 Drawing Conclusions And Interpreting Data
Once you have collected, tabulated and displayed your results, you can use them to draw a conclusion. When you are thinking about a conclusion, look right back to the start of your experiment where you were told (or you decided) what you were to investigate....
- #69 How To Get High Marks In Paper 3 - Variables
Many of the experiments that you will do during your AS course, and usually Question 1 in the examination paper, will investigate the effect of one factor on another. These factors are called variables. Types of variables The factor that you change...
- # 39 The Need For Transport Systems In A Multicellular Organism
The transport system enables the rapid delivery of nutrients and O2 to as well as the removal of metabolic waste products (including CO2) from all cells of the body for survival. All cells need to take in substances from their...
- #23.1 Cell Membranes And Transport - Syllabus 2015
? Fluid mosaic model of membrane structure ? Movement of substances into and out of cells Learning Outcomes Candidates should be able to: (a) describe and explain the fluid mosaic model of membrane structure, including an outline of the roles of phospholipids,...
