Biology
 Once you have collected, tabulated and displayed your results, you can use them to draw a conclusion. When you are thinking about a conclusion, look right back to the start of your experiment where you were told (or you decided) what you were to investigate.
For example:
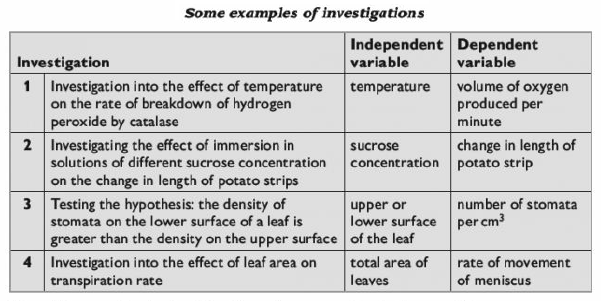
? In investigation 1, investigating the effect of temperature on the rate of breakdown of hydrogen peroxide by catalase, your conclusion should provide an answer to this question.
? in investigation 2, investigating the effect of immersion in solutions of different sucrose concentration on the change in length of potato strips, your conclusion should state the relationship between the concentration of sucrose solution and the change in length of the potato strips.
? in investigation 4, testing the hypothesis: the density of stomata on the lower surface of a leaf is greater than the density on the upper surface, your conclusion should say whether your results support or disprove this hypothesis.
Explaining your reasoning
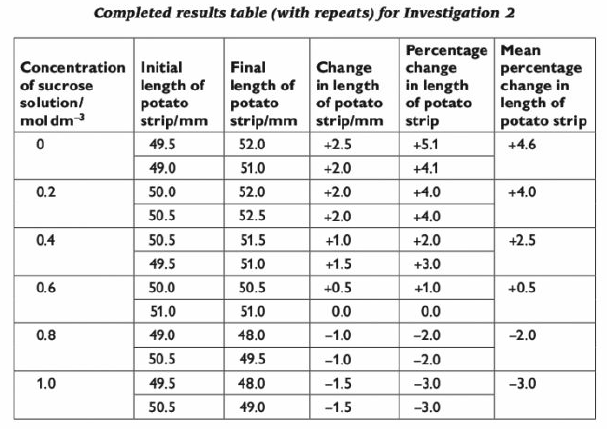
There will often be marks for explaining how you have reached your conclusion. Your reasoning should refer clearly to your results. For example, your conclusion to investigation 2 (whose results are shown in the table below) might be:

Showing your working, and significant figures
You may be asked to carry out a calculation and to show your working. There will be marks for doing this. If you do not show your working clearly, then you wiil not get full marks, even if your answer is absolutely correct.
For example, imagine you have measured four lengths as 46mm, 53mm, 52mm and 48mm. You are asked to calculate the mean and to show your working. You should write this down properly as:
 You've already seen, on the post #70, that the final answer to a calculation should have the same number of significant figures as the original numbers you were working from. If you do the calculation above, you'll find the answer you get is 49.75. But the original measurements were only to two significant figures (a whole number of mm) so that is how you should give the final answer to your calculation. You must round the answer up or down to give the same number of significant figures as the original values from which you are working.
There's another example of showing your working on this post. (page 119)
- Osmosis Experiment
Here are the photos illustrating the change in flexibility of the potato strips depending on whether water moved in or out by osmosis: ...
- Diffusion And Osmosis
Movement in a and out of cells (some key terms): Diffusion: the movement of a substance from a high concentration to a lower one as a result of their random movement. Give an example of diffusion Osmosis: The diffusion of water molecules from a...
- #74 Identifying Sources Of Error
It is very important to understand the difference between experimental errors and 'mistakes'. A mistake is something that you do incorrectly, such as misreading the scale on a thermometer, or taking a reading at the wrong time, or not emptying...
- #69 How To Get High Marks In Paper 3 - Variables
Many of the experiments that you will do during your AS course, and usually Question 1 in the examination paper, will investigate the effect of one factor on another. These factors are called variables. Types of variables The factor that you change...
- # 26 Surface Area To Volume Ratios, Investigating Diffusion
As the radius of a cell ? from 1x to 3x (left), the surface area ? from 1x to 9x, and the volume ? from 1x to 27x. Source: Nature Education As a cell increases in size, there is less surface area in proportion to its volume. Relatively there...
Biology
# 73 Drawing conclusions and interpreting data

For example:
 |
? in investigation 2, investigating the effect of immersion in solutions of different sucrose concentration on the change in length of potato strips, your conclusion should state the relationship between the concentration of sucrose solution and the change in length of the potato strips.
? in investigation 4, testing the hypothesis: the density of stomata on the lower surface of a leaf is greater than the density on the upper surface, your conclusion should say whether your results support or disprove this hypothesis.
Explaining your reasoning
There will often be marks for explaining how you have reached your conclusion. Your reasoning should refer clearly to your results. For example, your conclusion to investigation 2 (whose results are shown in the table below) might be:

A sucrose solution with a concentrations of 0.6 moldm-3 and below caused an increase in length of the potato strips. A sucrose solution with a concentration of 0.8 moldm-3 and above caused a decrease in length of the potato strips. From the graph, the solution that I would expect to cause no change in length of the strips would be 0.62 moldm-3.
The strips gained in length because they took up water, which was because the water potential of the sucrose solution was greater than the water potential in the potato cells. This therefore means that the water potential inside the potato cells was the same as the water potential of a 0.62 moldm-3 sucrose solution.
Showing your working, and significant figures
You may be asked to carry out a calculation and to show your working. There will be marks for doing this. If you do not show your working clearly, then you wiil not get full marks, even if your answer is absolutely correct.
For example, imagine you have measured four lengths as 46mm, 53mm, 52mm and 48mm. You are asked to calculate the mean and to show your working. You should write this down properly as:

There's another example of showing your working on this post. (page 119)
- Osmosis Experiment
Here are the photos illustrating the change in flexibility of the potato strips depending on whether water moved in or out by osmosis: ...
- Diffusion And Osmosis
Movement in a and out of cells (some key terms): Diffusion: the movement of a substance from a high concentration to a lower one as a result of their random movement. Give an example of diffusion Osmosis: The diffusion of water molecules from a...
- #74 Identifying Sources Of Error
It is very important to understand the difference between experimental errors and 'mistakes'. A mistake is something that you do incorrectly, such as misreading the scale on a thermometer, or taking a reading at the wrong time, or not emptying...
- #69 How To Get High Marks In Paper 3 - Variables
Many of the experiments that you will do during your AS course, and usually Question 1 in the examination paper, will investigate the effect of one factor on another. These factors are called variables. Types of variables The factor that you change...
- # 26 Surface Area To Volume Ratios, Investigating Diffusion
As the radius of a cell ? from 1x to 3x (left), the surface area ? from 1x to 9x, and the volume ? from 1x to 27x. Source: Nature Education As a cell increases in size, there is less surface area in proportion to its volume. Relatively there...
