Biology
 Many of the experiments that you will do during your AS course, and usually Question 1 in the examination paper, will investigate the effect of one factor on another. These factors are called variables.
Types of variables
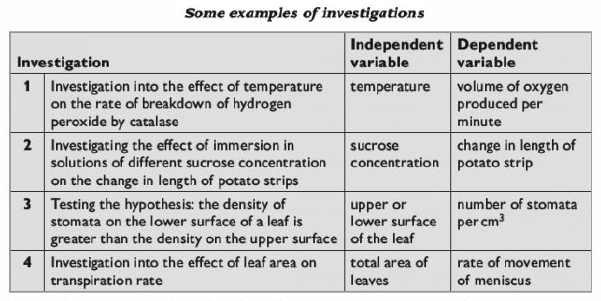
The factor that you change or select is called the independent variable. The factor that is affected (and that you measure when you collect your results) is the dependent variable. The table shows some examples.
Making decisions about the independent variable
You may have to make your own decisions about the range and interval of the independent variable.
Let's think about investigation 1 in the table above - investigating the effect of temperature on the rate of breakdown of hydrogen peroxide by catalase.
The independent variable is the temperature. First, decide on the range of temperatures you will use. The range is the spread between the highest and lowest value. This will be affected by:
? the apparatus you have available to you, which will determine the possible range of temperatures you can produce. In this case, you will probably be using a water bath. If you are lucky, you may have a thermostatically controlled water bath, but in the exam you will probably have to use a beaker of water whose temperature you can control by adding ice or by heating it.
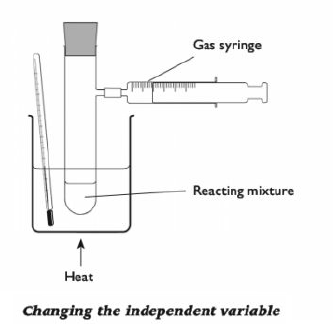
? your knowledge about the range of temperature over which the rate of activity of the enzyme is likely to be affected. Even if you could manage it, there wouldn't be much point in trying temperatures as low as - 500C or as high as 2000C. However, you probably know that various enzymes can have optimum temperatures anywhere between 200C and 800C, so you should include these values in the range.
Next, decide on the intervals that you will use. The interval is the distance between the values that you choose. This will be affected by:
? the number of different values you can fit in within your chosen range, and how much time you have available to you. For example, you might ideally like to use intervals of 50C, so that you set up water baths at 00C, 50C and so on, all the way up to 800C. But obviously that would not be sensible if you only have five water baths, or if you only have 1 hour to do the experiment.
? the number of results you need to obtain. You are going to be looking for any pattern in the relationship between the independent variable (temperature) and the dependent variable (rate of reaction). You will need at least 5 readings to see any pattern. There is really no point trying to draw a graph if there will be fewer than 5 points on it. So, if your range of temperatures is 00C to 800C, you could use intervals of 200C. This would give you 5 readings - 0,20,40, 60 and 800C.
Producing different concentrations of a solution
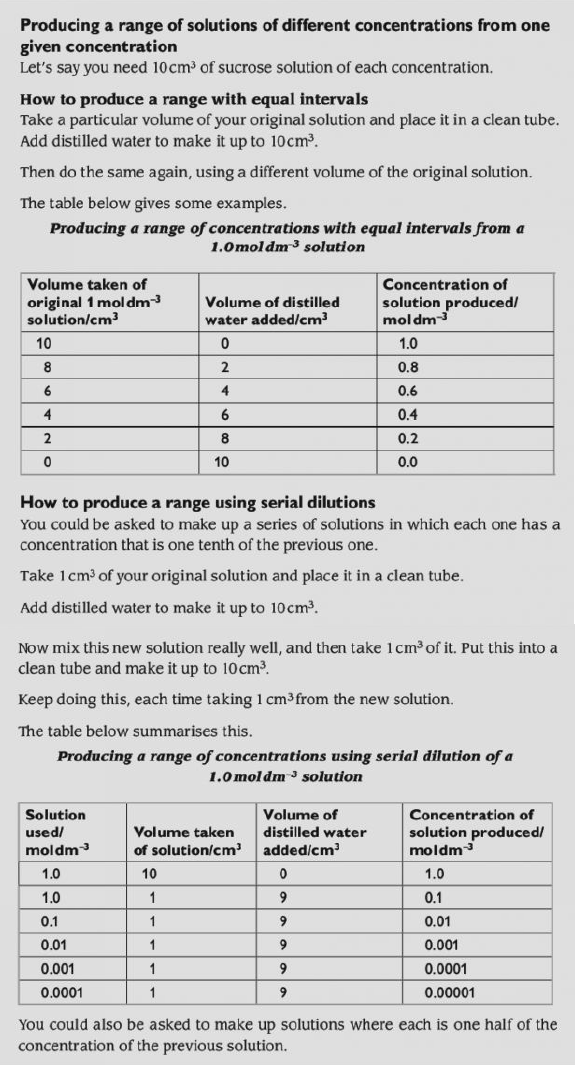
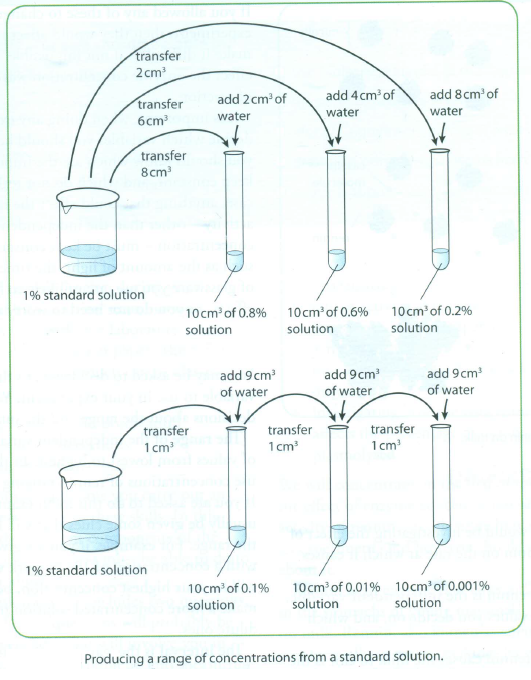
In investigation 2, investigating the effect of immersion in solutions of different sucrose concentration on the change in mass of potato strips, the independent variable is the concentration of a solution. You may be given a sucrose solution of a particular concentration, and then be asked to produce a suitable range of concentrations to carry out the experiment.
The range you should use will usually be from 0 (distilled water) up to the concentration of the solution you have been given (because obviously you can't easily make that into a more concentrated solution).
The intervals you use could be either:
? all the same distance apart, for example concentrations of 0.8, 0.6, 0.4 and 0.2 moldm-3 (and, of course, 0.0 moldm-3)
Continuous and discontinuous variables
In investigation 1, the independent variable (temperature) is continuous. This means that we can choose any value within the range we have decided to use. This is also true for investigation 2, where we can choose any value of concentration within the range we have decided to use.
Sometimes, however, the independent variable is discontinuous. This means that there is only a limited number of possible values. For example, in investigation 3, testing the hypothesis: the density of stomata on the lower surface of a leaf is greater than the density on the upper surface, the independent variable has only two possible 'values' - either the upper surface of the leaf, or the lower
surface of the leaf. So you don't have any choice about the range or intervals at all!
Tips
During your course:
? Every time you do an experiment, identify and write down the independent variable and the dependent variable.
? Every time you do an experiment, think about the range and the intervals of the values you are using for the independent variable. For your own benefit, write down what the range is and what the intervals are, just to help you to think about them.
? learn how to make up dilutions from a solution of a given concentration, and practise doing this until you feel really confident about it.
In the exam:
? Read the question carefully, then identify the independent variable and the dependent variable (even if the question does not ask you to do this].
? Next, decide if the independent variable is continuous or discontinuous (see above).
? If it is continuous, read the question carefully to see if you have been told the range and intervals to use, or if you are being asked to decide these for yourself.
Controlling the control variables
In your experiment, it is important to try to make sure that the only variable that could be affecting the dependent variable is the independent variable that you are investigating. If you think there are any other variables that might affect it, then you must try to keep these constant.
Look back at the Table 1 at the beginning of the post.
In investigation 1, the important control variables would be the concentration and volume of the enzyme solution and the concentration and volume of the hydrogen peroxide solution. Changes in any of these would have a direct effect on the rate of reaction.
In investigation 2, the important control variables would be the dimensions of the potato strips and the potato tuber from which they came. You also need to think about time, but here the important thing is that the strips are left in the solution for long enough for equilibrium to be reached - after that, it doesn't really matter if one is left for slightly longer than another. You also need to be sure that all the strips are completely immersed in the solution, although the actual volume of the solution
doesn't matter. Temperature, too, won't affect the final result, but it could affect the speed at which equilibrium is reached - if you leave the strips for long enough, then it does not really matter If the temperature varies.
In biology, we often want to do experiments where it is not possible to control all the variables. For example, we might want to investigate the effect of body mass index on heart rate when at rest. There are all sorts of other variables that might affect resting heart rate, such as gender, age, fitness, when a person last ate and so on. In this case, we just have to do the best we can, for example, by limiting our survey to males between the ages of 20 and 25. If we can collect results from a large random sample
among this group of males, then we can hope that at least we will be able to see if there appearsto be a relationship between our independent and dependent variables.
Tips
During your course:
? Every time you do an experiment, think about which variables you have been told to control, or make your own decision about which ones are important to control. Get to know the standard ways of controlling variables such as temperature (use water baths), pH (use buffer solutions) and other variables.
In the exam:
? If you are not told what variables to control, then think about these carefully before deciding what you will control and how you will do it.
When to measure the dependent variable
In many experiments you will need to decide when, and how often, you should take a reading, observation or measurement of the dependent variable.
? With some investigations, you will need to leave things long enough for whatever is happening to finish happening. This would be important in investigation 2, where you would need to leave the potato strips in the sucrose solutions for long enough for equilibrium to be reached.
? With some investigations, you may need to begin taking readings straight away. This would be important in investigation 1, where you should begin measuring the volume of oxygen released each minute from time 0, which is the moment that the enzyme and its substrate are mixed.
? With some investigations, you may need to allow time for a process to settle down to a steady rate before you begin to take readings. This would be important in investigation 4, where you would be measuring the rate of transpiration in a particular set of conditions.
Tips
During your course:
? Every time you do an experiment where time is involved, think about why you should start timing from a particular moment, and when and why you should take readings.
In the exam:
? Think carefully about whether or not time is important. If you think it is, then decide when you will start taking readings, and how often you will take them. Remember that if you are going to use them to draw a graph, you will need at least 5 points to plot.
- Homework
Think of a hypothesis and write down what the variables would be for an experiment that would test your hypothesis. You should have: Independent variable, dependent variable, controlled variables, experimental group and control group. Have this written...
- #76 Summary Of Practical Skills
1 In an experiment investigating the effect of one variable on another, the independent variable is the one that you change and the dependent variable is the one that you measure. All other variables should be controlled (kept constant). 2 The...
- #74 Identifying Sources Of Error
It is very important to understand the difference between experimental errors and 'mistakes'. A mistake is something that you do incorrectly, such as misreading the scale on a thermometer, or taking a reading at the wrong time, or not emptying...
- # 73 Drawing Conclusions And Interpreting Data
Once you have collected, tabulated and displayed your results, you can use them to draw a conclusion. When you are thinking about a conclusion, look right back to the start of your experiment where you were told (or you decided) what you were to investigate....
- # 72 Graphs And Other Ways Of Displaying Data
When you have collected your data and completed your results table, you will generally want to display the data so that anyone looking at them can see any patterns. 1. Line graphs Line graphs are used when both the independent variable and...
Biology
#69 How to get high marks in Paper 3 - Variables

Types of variables
The factor that you change or select is called the independent variable. The factor that is affected (and that you measure when you collect your results) is the dependent variable. The table shows some examples.
 |
| Table 1 |
If you are investigating the effect of one variable on another, then you need to be sure that there are no other variables that might be affecting the results. It is important to identify these and - if possible - keep them constant. These are sometimes called control variables.
Making decisions about the independent variable
You may have to make your own decisions about the range and interval of the independent variable.
Let's think about investigation 1 in the table above - investigating the effect of temperature on the rate of breakdown of hydrogen peroxide by catalase.
The independent variable is the temperature. First, decide on the range of temperatures you will use. The range is the spread between the highest and lowest value. This will be affected by:
? the apparatus you have available to you, which will determine the possible range of temperatures you can produce. In this case, you will probably be using a water bath. If you are lucky, you may have a thermostatically controlled water bath, but in the exam you will probably have to use a beaker of water whose temperature you can control by adding ice or by heating it.

Next, decide on the intervals that you will use. The interval is the distance between the values that you choose. This will be affected by:
? the number of different values you can fit in within your chosen range, and how much time you have available to you. For example, you might ideally like to use intervals of 50C, so that you set up water baths at 00C, 50C and so on, all the way up to 800C. But obviously that would not be sensible if you only have five water baths, or if you only have 1 hour to do the experiment.
? the number of results you need to obtain. You are going to be looking for any pattern in the relationship between the independent variable (temperature) and the dependent variable (rate of reaction). You will need at least 5 readings to see any pattern. There is really no point trying to draw a graph if there will be fewer than 5 points on it. So, if your range of temperatures is 00C to 800C, you could use intervals of 200C. This would give you 5 readings - 0,20,40, 60 and 800C.
Producing different concentrations of a solution
In investigation 2, investigating the effect of immersion in solutions of different sucrose concentration on the change in mass of potato strips, the independent variable is the concentration of a solution. You may be given a sucrose solution of a particular concentration, and then be asked to produce a suitable range of concentrations to carry out the experiment.
The range you should use will usually be from 0 (distilled water) up to the concentration of the solution you have been given (because obviously you can't easily make that into a more concentrated solution).
The intervals you use could be either:
? all the same distance apart, for example concentrations of 0.8, 0.6, 0.4 and 0.2 moldm-3 (and, of course, 0.0 moldm-3)


In investigation 1, the independent variable (temperature) is continuous. This means that we can choose any value within the range we have decided to use. This is also true for investigation 2, where we can choose any value of concentration within the range we have decided to use.
Sometimes, however, the independent variable is discontinuous. This means that there is only a limited number of possible values. For example, in investigation 3, testing the hypothesis: the density of stomata on the lower surface of a leaf is greater than the density on the upper surface, the independent variable has only two possible 'values' - either the upper surface of the leaf, or the lower
surface of the leaf. So you don't have any choice about the range or intervals at all!
Tips
During your course:
? Every time you do an experiment, identify and write down the independent variable and the dependent variable.
? Every time you do an experiment, think about the range and the intervals of the values you are using for the independent variable. For your own benefit, write down what the range is and what the intervals are, just to help you to think about them.
? learn how to make up dilutions from a solution of a given concentration, and practise doing this until you feel really confident about it.
In the exam:
? Read the question carefully, then identify the independent variable and the dependent variable (even if the question does not ask you to do this].
? Next, decide if the independent variable is continuous or discontinuous (see above).
? If it is continuous, read the question carefully to see if you have been told the range and intervals to use, or if you are being asked to decide these for yourself.
Controlling the control variables
In your experiment, it is important to try to make sure that the only variable that could be affecting the dependent variable is the independent variable that you are investigating. If you think there are any other variables that might affect it, then you must try to keep these constant.
Look back at the Table 1 at the beginning of the post.
In investigation 1, the important control variables would be the concentration and volume of the enzyme solution and the concentration and volume of the hydrogen peroxide solution. Changes in any of these would have a direct effect on the rate of reaction.
In investigation 2, the important control variables would be the dimensions of the potato strips and the potato tuber from which they came. You also need to think about time, but here the important thing is that the strips are left in the solution for long enough for equilibrium to be reached - after that, it doesn't really matter if one is left for slightly longer than another. You also need to be sure that all the strips are completely immersed in the solution, although the actual volume of the solution
doesn't matter. Temperature, too, won't affect the final result, but it could affect the speed at which equilibrium is reached - if you leave the strips for long enough, then it does not really matter If the temperature varies.
In biology, we often want to do experiments where it is not possible to control all the variables. For example, we might want to investigate the effect of body mass index on heart rate when at rest. There are all sorts of other variables that might affect resting heart rate, such as gender, age, fitness, when a person last ate and so on. In this case, we just have to do the best we can, for example, by limiting our survey to males between the ages of 20 and 25. If we can collect results from a large random sample
among this group of males, then we can hope that at least we will be able to see if there appearsto be a relationship between our independent and dependent variables.
Tips
During your course:
? Every time you do an experiment, think about which variables you have been told to control, or make your own decision about which ones are important to control. Get to know the standard ways of controlling variables such as temperature (use water baths), pH (use buffer solutions) and other variables.
In the exam:
? If you are not told what variables to control, then think about these carefully before deciding what you will control and how you will do it.
When to measure the dependent variable
In many experiments you will need to decide when, and how often, you should take a reading, observation or measurement of the dependent variable.
? With some investigations, you will need to leave things long enough for whatever is happening to finish happening. This would be important in investigation 2, where you would need to leave the potato strips in the sucrose solutions for long enough for equilibrium to be reached.
? With some investigations, you may need to begin taking readings straight away. This would be important in investigation 1, where you should begin measuring the volume of oxygen released each minute from time 0, which is the moment that the enzyme and its substrate are mixed.
? With some investigations, you may need to allow time for a process to settle down to a steady rate before you begin to take readings. This would be important in investigation 4, where you would be measuring the rate of transpiration in a particular set of conditions.
Tips
During your course:
? Every time you do an experiment where time is involved, think about why you should start timing from a particular moment, and when and why you should take readings.
In the exam:
? Think carefully about whether or not time is important. If you think it is, then decide when you will start taking readings, and how often you will take them. Remember that if you are going to use them to draw a graph, you will need at least 5 points to plot.
- Homework
Think of a hypothesis and write down what the variables would be for an experiment that would test your hypothesis. You should have: Independent variable, dependent variable, controlled variables, experimental group and control group. Have this written...
- #76 Summary Of Practical Skills
1 In an experiment investigating the effect of one variable on another, the independent variable is the one that you change and the dependent variable is the one that you measure. All other variables should be controlled (kept constant). 2 The...
- #74 Identifying Sources Of Error
It is very important to understand the difference between experimental errors and 'mistakes'. A mistake is something that you do incorrectly, such as misreading the scale on a thermometer, or taking a reading at the wrong time, or not emptying...
- # 73 Drawing Conclusions And Interpreting Data
Once you have collected, tabulated and displayed your results, you can use them to draw a conclusion. When you are thinking about a conclusion, look right back to the start of your experiment where you were told (or you decided) what you were to investigate....
- # 72 Graphs And Other Ways Of Displaying Data
When you have collected your data and completed your results table, you will generally want to display the data so that anyone looking at them can see any patterns. 1. Line graphs Line graphs are used when both the independent variable and...
